Currently building - June 2026
PC Stats
A desktop usage tracker for Linux, starting with a click heatmap and growing into a dashboard for understanding how I use my computer.
What I Wanted to Track
PC Stats started from a simple question: what does my computer use actually look like if I collect the data myself? The first version focuses on mouse clicks, building a heatmap from the places I click most often.
I did not start with a UI. Most of the early work was just figuring out how to read mouse position data on Wayland without the whole thing falling apart. Once I had clicks being recorded, the project shifted from a quick experiment into something closer to a real app: collect data quietly, store it properly, and show it in a way that is actually useful.
Making the Collector Less Sketchy
The first working version was very tied to my own machine. It had my mouse model hard-coded, assumed a specific desktop setup, and was all packed into one large Python file. That was fine for proving the idea, but not fine if I wanted anyone else to use it.
I split the backend into modules, moved the data into SQLite, and added proper device detection so it can find the user's mouse instead of relying on mine. It can also handle disconnects, reconnects, and multiple mice being connected at once.
There is also a small JavaScript helper involved in getting mouse position data. Rather than shipping that as a loose file, the Python code now generates it in the user's share directory and runs it from there. It is a small detail, but it makes the project feel much less thrown together.
The Linux Problem
Compatibility has been one of the awkward parts. I started on KDE, which made the first version more complicated than I expected. A lot of the code was accidentally specific to my own window manager and needed to be pulled apart before it could support other setups.
The structure is now there to detect the desktop environment or window manager and adjust behaviour from there. It is not fully universal yet, but it has already expanded beyond the original hard-coded setup, and supporting more Linux environments should be a lot easier from here.
Turning Raw Clicks Into Something Visual
For the dashboard, I decided not to build another native app. The data viewer is a website where you can upload collected data and see the results. That makes it easier to demo, easier to test with sample data, and avoids adding even more platform-specific work.
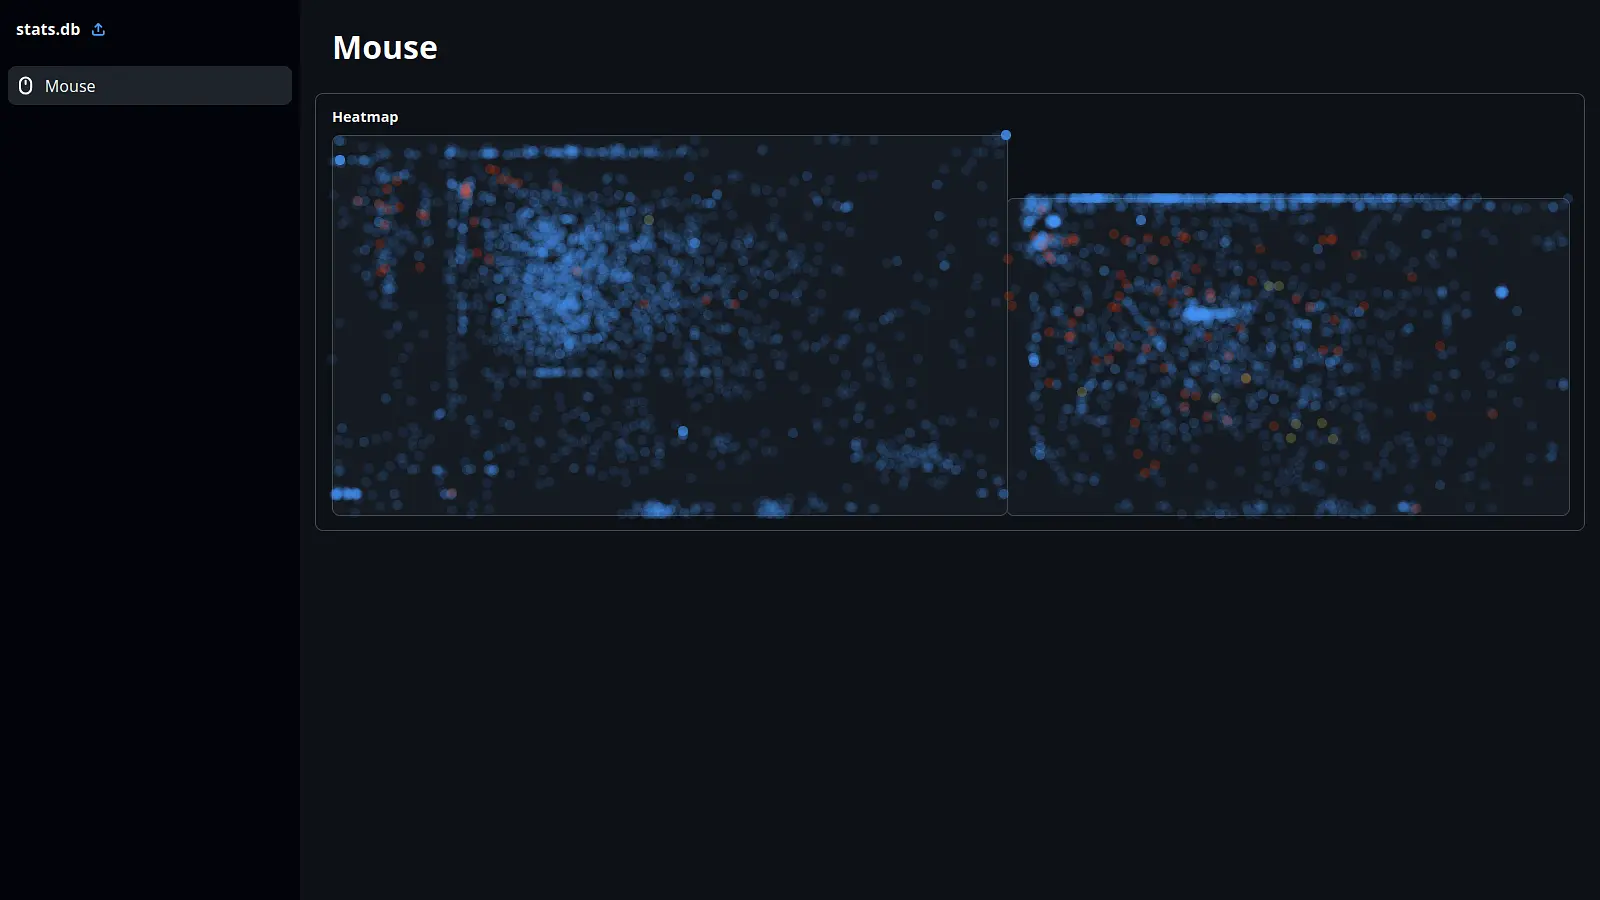
The current dashboard is still early, but the heatmap is the main thing I am excited about. It takes the click data and turns it into a visual map of where attention and interaction are happening on the screen. The visual direction is getting closer, but performance still needs work because the heatmap can get slow.
Where It Is Now
The project is unfinished, but it is much healthier than it was at the start. The backend used to block a full CPU core, which is a pretty bad look for a background stats tool. It now sleeps properly when idle, and the code is organised enough that adding features does not feel painful.
My plan is to get the core project ship-ready first: stable collection, persistent storage, decent Linux compatibility, and a dashboard that explains the data clearly. After that, I can add more stats one by one instead of trying to build everything at once.